rtz - 16-7-2019 at 10:21 AM
What's the easiest way to run these projections out too see what the level will be in September and October based on this rate of decline short of
doing it manually?

https://nwis.waterdata.usgs.gov/nwis/uv?site_no=07159550
indigo_wolf - 16-7-2019 at 12:06 PM
If you have MS Office...
TREND function and other ways to do trend analysis in Excel
https://www.ablebits.com/office-addins-blog/2019/03/27/excel-trend-function/
ATB,
Sam
Prussik - 16-7-2019 at 01:15 PM
L=1200.34-0.08d where L is the level and d is the number of days from July 1.
Randy - 16-7-2019 at 06:31 PM
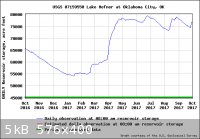
Might be easier to look around that website for some historical data. Here is the 2017 water year. I assume this is a lake where they manage the
water levels so it is going be driven by rainfall, the decisions made, more than just following a trend. Looking at last year it trended down in
July only to come back up in August and September. (This is storage but it is going to be related to water level.)
https://waterdata.usgs.gov/nwis/wys_rpt?dv_ts_ids=111115&...

nate76 - 16-7-2019 at 08:19 PM
Ya, I would have to agree with Randy - water level rates are very seasonal. The best way to predict levels would be to take a look at a one-year
chart, then add or subtract some to your months of interest, based on whether you're having a wetter than normal or drier-than-normal year.
We have a similar problem here at Lake McConaughy. Water levels are crazy high this year from the record snowpack in the mountains. Unfortunately,
that means most of the kite launch areas are underwater at the moment. Hoping things start to recede a bit for our family vacation at the end of
July...

